Vés al contingut

Fitxer:BAMS climate assess boulder water vapor 2002 - 2.png

El contingut de la pàgina no s'admet en altres llengües.
De la Viquipèdia, l'enciclopèdia lliure

BAMS_climate_assess_boulder_water_vapor_2002_-_2.png (775 × 425 píxels, mida del fitxer: 12 Ko, tipus MIME: image/png)

Descripció a Commons

Resum

Descripció
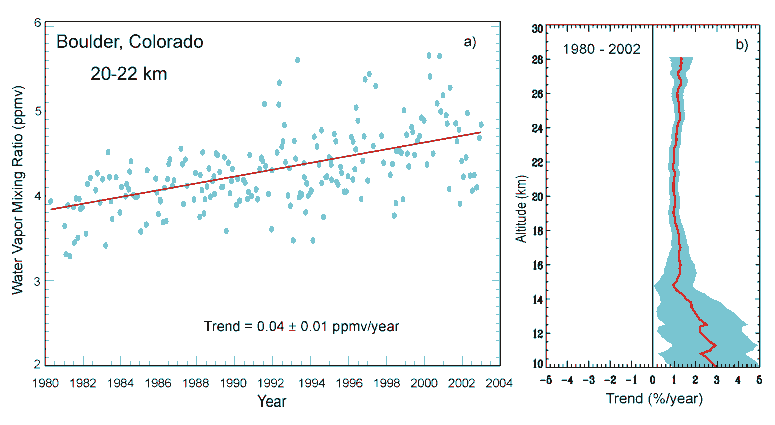
English: Stratospheric water vapor 1% increase. 30% may be due to increased methane.
  • Observations using balloon-borne frost-point hygrometers, have detected an approximately 1% per year increase in stratospheric water vapor at Boulder, Colorado, since 1980. Besides implications for climate change, increased water vapor can affect the rate of chemical ozone loss, for example, by increasing the incidence of polar stratospheric clouds. Satellite measurements of water vapor, although not of adequate length for accurate trend determination, suggest that the increase may extend to other latitudes.[1]
  • Observations have provided evidence for a widespread increase in stratospheric water vapor, which plays a role both in cooling the lower stratosphere and in depleting ozone through chemical interactions, thereby contributing to climate processes. However, the water vapor trends are not fully defined, nor are their cause understood.[2]
  • Stratospheric water vapor measurements at a single location (Boulder, Colorado, U.S., 40°N) for the period 1981-2000 show a statistically significant increase of approximately 1%/year over altitudes 15-28 km. For the shorter period 1991-2001, global satellite measurements covering latitudes 60°N-60°S show a similar trend of 0.6-0.8%/year for altitudes ~25-50 km, but no significant trend at lower altitudes. The increases in water vapor are substantially larger than can be explained by tropospheric methane trends. Characterization of stratospheric water vapor trends is limited by the lack of global long-term measurements.[3]
Aquesta imatge (de tipus gràfic) s'hauria de tornar a crear utilitzant gràfics vectorials com ara un fitxer SVG. Això té diversos avantatges; en trobareu més informació a Commons:Media for cleanup. Si ja disposeu d'una versió d'aquesta imatge en format SVG, us preguem que la pengeu; després, reemplaceu aquesta plantilla amb la plantilla {{Vector version available|nom nou de la imatge.svg}} en aquesta imatge.
Font http://www.cmdl.noaa.gov/hotitems/watervapor.html
Autor NOAA

Llicència

Public domain
This image is in the public domain because it contains materials that originally came from the U.S. National Oceanic and Atmospheric Administration, taken or made as part of an employee's official duties.

العربية  čeština  Deutsch  Zazaki  English  español  eesti  suomi  français  hrvatski  magyar  italiano  日本語  한국어  македонски  മലയാളം  Plattdüütsch  Nederlands  polski  português  română  русский  sicilianu  slovenščina  Türkçe  Tiếng Việt  简体中文  繁體中文  +/−

Registre original de càrregues

Data/hora Dimensions Usuari/a Comentari
5 de juliol de 2006, 13:42:17 775 × 425 (13969 bytes) Nils Simon (discussió · contribucions) {{PD-USGov-DOC-NOAA}}

Llegendes

Afegeix una explicació d'una línia del que representa aquest fitxer

Elements representats en aquest fitxer

representa l'entitat

425 píxel

775 píxel

Historial del fitxer

Cliqueu una data/hora per veure el fitxer tal com era aleshores.

Data/horaMiniaturaDimensionsUsuari/aComentari
actual13:21, 21 ago 2014Miniatura per a la versió del 13:21, 21 ago 2014775 × 425 (12 Ko)GifTaggerBot: Converting file to superior PNG file. (Source: BAMS_climate_assess_boulder_water_vapor_2002.gif). This GIF was problematic due to non-greyscale color table.

La pàgina següent utilitza aquest fitxer:

Ús global del fitxer

Utilització d'aquest fitxer en altres wikis: