
Fitxer:CAPspendingbysector.png
No hi ha cap versió amb una resolució més gran.
CAPspendingbysector.png (611 × 382 píxels, mida del fitxer: 24 Ko, tipus MIME: image/png)
| Aquest fitxer i la informació mostrada a continuació provenen del dipòsit multimèdia lliure Wikimedia Commons. |

|
File:CAPspendingbysector.svg és una versió vectorial (SVG) d'aquest fitxer. En cas de ser millor, hauria de ser emprada en lloc d'aquesta imatge tramada.
File:CAPspendingbysector.png → File:CAPspendingbysector.svg
Per a més informació pel que fa als gràfics vectorials, llegiu la transició a SVG en Commons. També hi ha informació quant a la compatibilitat del MediaWiki amb les imatges SVG. |
 |
Transferred from en.wikipedia to Commons by Maksim.
La pàgina de descripció original era aquí. Els noms d'usuari a continuació es refereixen a en.wikipedia.
Resum
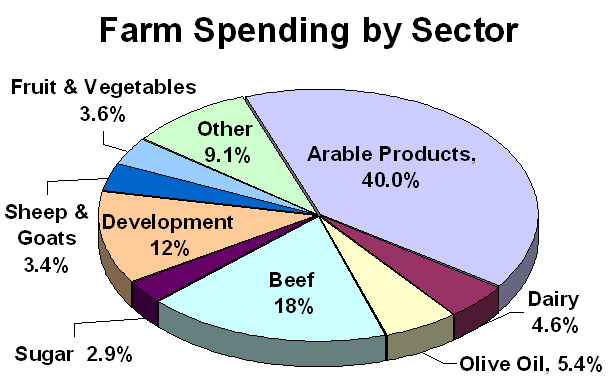
Pie chart showing percentages of CAP expenditure on different agricultural products. Created by me December 2005.
Llicència
| S'ha alliberat aquesta obra al domini públic pel seu autor Sandpiper de la Viquipèdia en anglès. Això s'aplica a tot el món. En alguns països això pot no ser legalment possible, en tal cas: Sandpiper concedeix a tothom el dret d'usar aquesta obra per a qualsevol propòsit, sense cap condició llevat d'aquelles requerides per la llei. |
| date/time | username | edit summary |
|---|---|---|
| 21:26, 19 December 2005 | en:User:Sandpiper | (Pie chart showing percentages of CAP expenditure on different agricultural products. Created by me December 2005.) |

Registre original de càrregues
Legend: (cur) = this is the current file, (del) = delete this old version, (rev) = revert to this old version.
Click on date to download the file or see the image uploaded on that date.
- (del) (cur) 21:26, 19 December 2005 . . en:User:Sandpiper Sandpiper ( en:User_talk:Sandpiper Talk) . . 611x382 (24190 bytes) (Pie chart showing percentages of CAP expenditure on different agricultural products. Created by me December 2005.)
Historial del fitxer
Cliqueu una data/hora per veure el fitxer tal com era aleshores.
| Data/hora | Miniatura | Dimensions | Usuari/a | Comentari | |
|---|---|---|---|---|---|
| actual | 09:47, 1 abr 2006 | | 611 × 382 (24 Ko) | Maksim | La bildo estas kopiita de wikipedia:en. La originala priskribo estas: == Summary == Pie chart showing percentages of CAP expenditure on different agricultural products. Created by me December 2005. == Licensing == {{PD-self}} {| border="1" ! date/time | |
Ús del fitxer
La pàgina següent utilitza aquest fitxer:
Ús global del fitxer
Utilització d'aquest fitxer en altres wikis:
- Utilització a en.wikipedia.org
- Utilització a eo.wikipedia.org
- Utilització a hy.wikipedia.org
- Utilització a ia.wikipedia.org
- Utilització a ja.wikipedia.org
- Utilització a nl.wikipedia.org